ADX and DI는 트레이딩뷰에서 ‘BeikabuOyaji‘ 라는 유저에 의해 공개되었으며, 현재 트레이딩뷰 커뮤니티 TOP 7에 랭크된 지표입니다. 내장 지표 중 ‘디렉셔널 무브먼트 인덱스(DMI)’와 비슷하지만 ADX 계산방식이 조금 다른 것으로 보입니다.

ADX and DI 란?
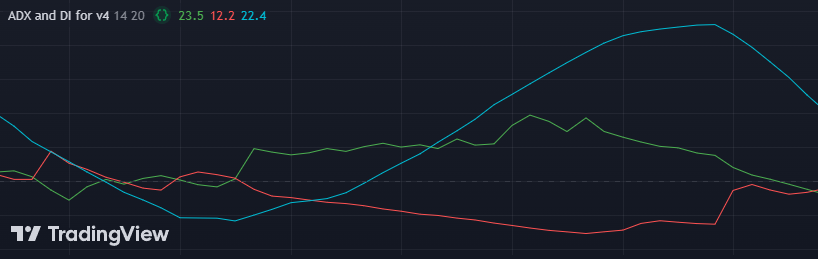
Average Directional Index (ADX), 마이너스 방향 지수 (-DI), 플러스 방향 지수 (+DI)는 웰스 와일더(Welles Wilder)가 개발한 거래 시스템을 구성하는 방향성 움직임 지표들의 집합을 나타냅니다. 플러스 및 마이너스 방향성 움직임은 방향성 움직임 시스템의 핵심을 형성합니다. 와일더는 두 개의 연속된 저점 간의 차이와 각각의 고점 간의 차이를 비교하여 방향성 움직임을 결정했습니다. 이 세 가지 지표를 함께 사용하면, 추세의 방향과 강도를 파악할 수 있습니다.
컴퓨터가 보편화되기 전에 개발된 지표들이지만, 그 계산 방식은 매우 정교하고 오늘날에도 여전히 효과적으로 사용되고 있습니다.
ADX and DI 구현
pip install pandas ccxt numpy pinetopyimport pandas as pd
import ccxt
import pinetopy as pp
import numpy as np
# 예시) 바이낸스 선물 BTCUSDT, 1시간 봉
bnb = ccxt.binance({'options': { 'defaultType': 'future' }})
ohlcv = bnb.fetch_ohlcv(symbol="BTC/USDT", timeframe="1h", limit=500)
df = pd.DataFrame(ohlcv, columns=['time', 'open', 'high', 'low', 'close', 'volume'])
df['time'] = pp.kst(df['time'])
def ADXnDI(df, length=14):
true_range = pp.atr(df, length)
high, low = df['high'], df['low']
dm_plus = high - high.shift(1)
dm_minus = low.shift(1) - low
dm_plus = np.where(dm_plus > dm_minus, np.maximum(dm_plus, 0), 0)
dm_minus = np.where(dm_minus > dm_plus, np.maximum(dm_minus, 0), 0)
smoothed_dm_plus = pd.Series(dm_plus, index=df.index).ewm(alpha=1/length, adjust=False).mean()
smoothed_dm_minus = pd.Series(dm_minus, index=df.index).ewm(alpha=1/length, adjust=False).mean()
di_plus = (smoothed_dm_plus / true_range) * 100
di_minus = (smoothed_dm_minus / true_range) * 100
dx = (np.abs(di_plus - di_minus) / (di_plus + di_minus)) * 100
adx = dx.rolling(window=length).mean()
df['DIPlus'] = di_plus.round(1)
df['DIMinus'] = di_minus.round(1)
df['ADX'] = adx.round(1)
return df
print(ADXnDI(df, length=14)) # 트레이딩뷰 디폴트 값Check
트레이딩뷰 차트와 비교

