Choppiness Index(차피니스 인덱스)는 시장의 추세 강도와 변동성을 측정하는 기술적 지표로, 현재 시장이 추세적인지 또는 횡보 상태인지를 판단하는 데 사용됩니다. 이 지표는 ATR을 기반으로 일정 기간 동안의 가격 변동성을 정량화하며, 값이 높으면 횡보장, 값이 낮으면 강한 추세장을 의미합니다. 일반적으로 0~100 범위에서 계산되며, 38.2 이하이면 강한 추세, 61.8 이상이면 횡보 가능성이 높다고 해석됩니다. 이동 평균, 볼린저 밴드 등과 함께 활용하여 진입 및 청산 전략을 보완하며, 단독 사용보다는 추세 추종 지표와 조합하여 분석하는 것이 효과적입니다.
Choppiness Index 구현
import pandas as pd
import ccxt
import pinetopy as pp
import numpy as np

# Binance Futures, BTCUSDT, 1h
bnb = ccxt.binance({'options': { 'defaultType': 'future' }})
ohlcv = bnb.fetch_ohlcv(symbol="BTC/USDT", timeframe="1h", limit=500)
df = pd.DataFrame(ohlcv, columns=['time', 'open', 'high', 'low', 'close', 'volume'])
df['time'] = pp.kst(df['time'])

# TradingView Default Settings
def main(df, length=14):
    atr_sum = df['high'].sub(df['low']).rolling(window=length).sum()
    high_max = df['high'].rolling(window=length).max()
    low_min = df['low'].rolling(window=length).min()

    ci = 100 * np.log10(atr_sum / (high_max - low_min)) / np.log10(length)
    df['CHOP'] = ci.round(2)

    return df

print(main(df))
Check
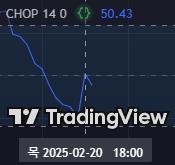
트레이딩뷰 차트와 비교