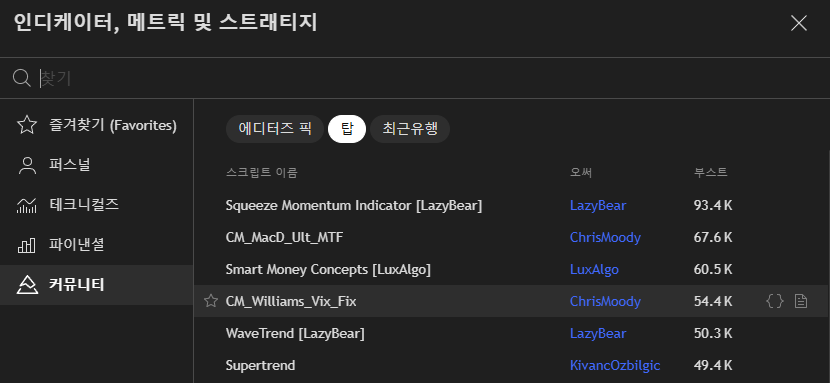
CM_Williams_Vix_Fix 지표는 트레이딩뷰 오픈 소스로 ‘ChrisMoody‘ 라는 유저가 공개하였으며,
현재 트레이딩뷰 커뮤니티 탑 4에 랭크되어있습니다.
💡 유저 설명 번역
Larry Williams가 개발한 이 놀라운 지표는, 주가지수에서 VIX와 동일한 시그널을 제공합니다. 하지만 이 지표는 모든 자산군에서 작동한다는 점이 큰 강점입니다. 저는 이 지표에 약간의 커스터마이징을 더해 히스토그램을 표시하도록 설정했습니다. 따라서 사용하는 자산군에 따라 설정을 약간 조정해야 할 수도 있습니다. 여기 보여드리는 값들은 기본 설정이며, 일봉 차트를 기준으로 설계되었지만 인트라데이 차트에서도 매우 잘 작동합니다.
CM_Williams_Vix_Fix 구현
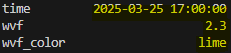
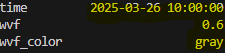
히스토그램 값과 색을 구해보겠습니다.
import pandas as pd
import ccxt
import pinetopy as pp
import numpy as np

# Binance Futures, BTCUSDT, 1h
bnb = ccxt.binance({'options': { 'defaultType': 'future' }})
ohlcv = bnb.fetch_ohlcv(symbol="BTC/USDT", timeframe="1h", limit=500)
df = pd.DataFrame(ohlcv, columns=['time', 'open', 'high', 'low', 'close', 'volume'])
df['time'] = pp.kst(df['time'])

# TradingView Default Settings
def main(df, pd_period=22, bbl=20, mult=2.0, lb=50, ph=0.85):
    highest_close = df['close'].rolling(window=pd_period).max()
    wvf = ((highest_close - df['low']) / highest_close) * 100

    mid_line = wvf.rolling(window=bbl).mean()
    s_dev = mult * wvf.rolling(window=bbl).std()
    upper_band = mid_line + s_dev
    range_high = wvf.rolling(window=lb).max() * ph

    df['wvf'] = wvf.fillna(0).round(1)
    df['wvf_color'] = np.where((wvf >= upper_band) | (wvf >= range_high), 'lime', 'gray')

    return df

print(main(df))
Check
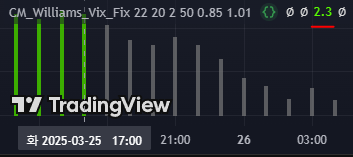
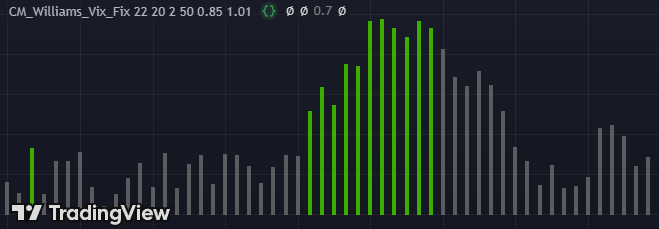
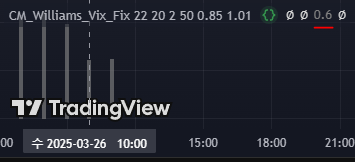
트레이딩뷰 차트와 비교
1️⃣
2️⃣