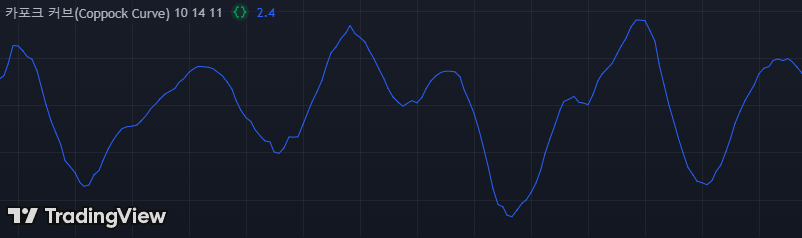
카포크 커브(Coppock Curve)는 장기적인 시장 모멘텀을 평가하는 지표로, 주식 시장의 저점 식별에 주로 사용됩니다. ROC와 WMA를 기반으로 계산되며, 값이 0을 상향 돌파하면 매수 신호로 해석됩니다. 주로 장기 투자자들이 강세장 진입 시점을 찾는 데 활용하며, 단기 변동성보다는 장기 흐름을 분석하는 데 초점이 맞춰져 있습니다. 매도 신호는 제공하지 않으며, 장기적인 저점과 추세 전환을 파악하는 용도로 사용됩니다.
Coppock Curve 구현
import pandas as pd
import ccxt
import pinetopy as pp
# Binance Futures, BTCUSDT, 1h
bnb = ccxt.binance({'options': { 'defaultType': 'future' }})
ohlcv = bnb.fetch_ohlcv(symbol="BTC/USDT", timeframe="1h", limit=500)
df = pd.DataFrame(ohlcv, columns=['time', 'open', 'high', 'low', 'close', 'volume'])
df['time'] = pp.kst(df['time'])
# TradingView Default Settings
def main(df, wma_length=10, long_roc_length=14, short_roc_length=11):
long_roc = pp.rate_of_change(df, len=long_roc_length)
short_roc = pp.rate_of_change(df, len=short_roc_length)
curve = pp.wma(long_roc + short_roc, length=wma_length)
df['Coppock_Curve'] = curve.round(1)
return df
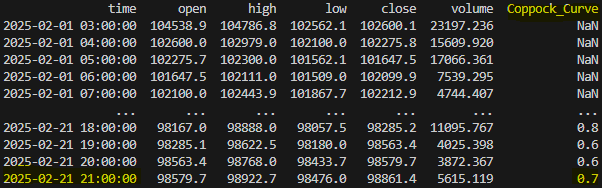
print(main(df))Check
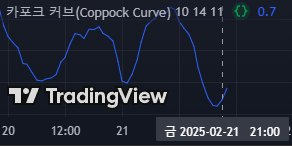
트레이딩뷰 차트와 비교