DMI(Directional Movement Index)는 추세의 방향과 강도를 동시에 측정하는 지표로, J. Welles Wilder Jr.가 개발한 기술적 분석 도구입니다. 이 지표는 가격이 상승 또는 하락하는 힘을 비교하여 시장이 어느 방향으로 강한지를 분석하는 데 사용됩니다. 일반적으로 ADX, +DI, -DI 세 가지 요소로 구성되며, 이를 통해 시장 추세가 강한지, 약한지, 그리고 어느 방향으로 진행되고 있는지를 파악할 수 있습니다. DMI는 개별적으로 사용할 수도 있지만, 추세 추종 전략과 함께 활용하면 더욱 강력한 신호를 제공할 수 있습니다.
DMI 구현
import pandas as pd
import ccxt
import pinetopy as pp # 0.1.0 버전 이상
import numpy as np
# Binance Futures, BTCUSDT, 1h
bnb = ccxt.binance({'options': { 'defaultType': 'future' }})
ohlcv = bnb.fetch_ohlcv(symbol="BTC/USDT", timeframe="1h", limit=500)
df = pd.DataFrame(ohlcv, columns=['time', 'open', 'high', 'low', 'close', 'volume'])
df['time'] = pp.kst(df['time'])
def main(df, adx_length=14, di_length=14):
high, low = df['high'], df['low']
dm_plus = high - high.shift(1)
dm_minus = low.shift(1) - low
dm_plus = np.where(dm_plus > dm_minus, np.maximum(dm_plus, 0), 0)
dm_minus = np.where(dm_minus > dm_plus, np.maximum(dm_minus, 0), 0)
smoothed_dm_plus = pp.rma(series=pd.Series(dm_plus, index=df.index), period=di_length)
smoothed_dm_minus = pp.rma(series=pd.Series(dm_minus, index=df.index), period=di_length)
true_range = pp.atr(df, length=di_length)
di_plus = (smoothed_dm_plus / true_range) * 100
di_minus = (smoothed_dm_minus / true_range) * 100
df['ADX'] = pp.adx(df,dilen=di_length, adxlen=adx_length)
df['DI+'] = di_plus
df['DI-'] = di_minus
return df[['time', 'ADX', 'DI+', 'DI-']]
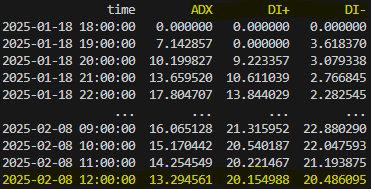
print(main(df, adx_length=14, di_length=14)) # TradingView Default SettingsCheck
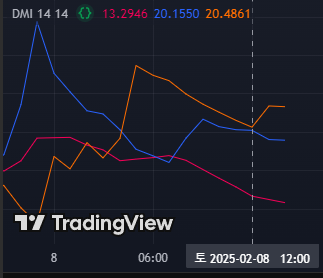
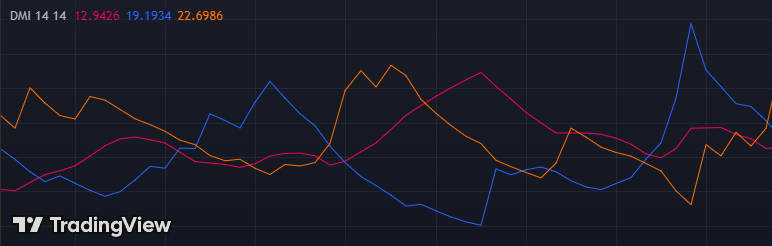
트레이딩뷰 차트와 비교