피셔 트랜스폼(Fisher Transform)은 John F. Ehlers가 개발한 지표로, 가격 데이터를 정규 분포로 변환하여 극단적인 움직임을 강조하는 기술적 지표입니다. 일반적인 가격 데이터는 정규 분포를 따르지 않지만, Fisher Transform을 적용하면 오실레이터 형태로 변환되어 과매수 및 과매도 구간을 명확하게 식별할 수 있습니다. 보통 Fisher 값이 극단적인 양수 또는 음수 영역에서 반전하면 매매 신호로 해석되며, 빠르고 명확한 트렌드 전환점을 찾는 데 도움을 줍니다.
Fisher Transform 구현
import pandas as pd
import ccxt
import pinetopy as pp
import numpy as np
# Binance Futures, BTCUSDT, 1h
bnb = ccxt.binance({'options': { 'defaultType': 'future' }})
ohlcv = bnb.fetch_ohlcv(symbol="BTC/USDT", timeframe="1h", limit=500)
df = pd.DataFrame(ohlcv, columns=['time', 'open', 'high', 'low', 'close', 'volume'])
df['time'] = pp.kst(df['time'])
# TradingView Default Settings
def main(df, length=9):
hl2 = (df['high'] + df['low']) / 2
high_max = hl2.rolling(length).max().bfill()
low_min = hl2.rolling(length).min().bfill()
norm_values = 0.66 * ((hl2 - low_min) / (high_max - low_min) - 0.5)
norm_values = norm_values.clip(-0.999, 0.999).fillna(0)
fish1 = np.zeros(len(df))
value = np.zeros(len(df))
for i in range(len(df)):
prev_value = value[i - 1] if i > 0 else 0
prev_fish1 = fish1[i - 1] if i > 0 else 0
if not np.isnan(norm_values.iloc[i]):
value[i] = 0.67 * prev_value + norm_values.iloc[i]
fish1[i] = 0.5 * np.log((1 + value[i]) / (1 - value[i])) + 0.5 * prev_fish1
df['Fisher'] = fish1.round(2)
df['Trigger'] = np.roll(fish1, 1).round(2)
return df
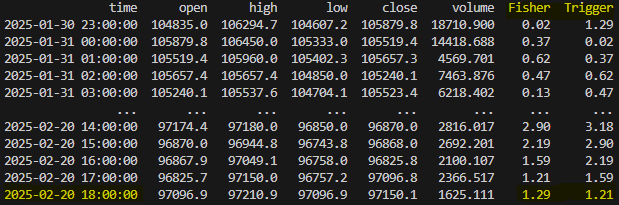
print(main(df))Check
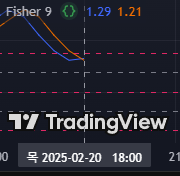
트레이딩뷰 차트와 비교