Pivot Points High Low(PH/PL) 지표는 특정 기간 동안의 최고점과 최저점을 기준으로 피벗 포인트를 찾는 기술적 지표입니다. 이는 추세의 전환점을 식별하는 데 유용하며, 지지선과 저항선 역할을 할 수 있습니다.
🔹 PH와 PL은 특정 캔들이 좌우 n개의 캔들보다 높거나 낮을 때 결정됩니다.
🔹 Pivot High (PH): 좌우 n개의 캔들보다 높은 High 값
🔹 Pivot Low (PL): 좌우 n개의 캔들보다 낮은 Low 값
Pivot Points High Low 구현
PH, PL 캔들만 가져오겠습니다.
import pandas as pd
import ccxt
import pinetopy as pp # 0.1.0 버전 이상
import numpy as np

# 예시) 비트코인 선물 BTCUSDT, 1시간 봉
bnb = ccxt.binance({'options': { 'defaultType': 'future' }})
ohlcv = bnb.fetch_ohlcv(symbol="BTC/USDT", timeframe="1h", limit=500)
df = pd.DataFrame(ohlcv, columns=['time', 'open', 'high', 'low', 'close', 'volume'])
df['time'] = pp.kst(df['time'])

def main(df, length=10):
    df = pp.pivot(data=df, pivot=length)

    # PH, PL
    pivot = df[(df['pivot_high'] == True) | (df['pivot_low'] == True)]
    return pivot[['time', 'pivot_high' , 'pivot_high_Value', 'pivot_low', 'pivot_low_value']]

print(main(df, length=10)) # 트레이딩뷰 기본 설정
Check
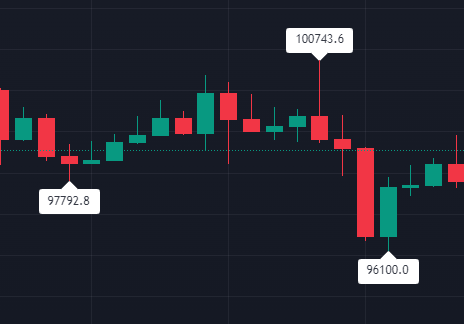
트레이딩뷰 차트와 최근 PH, PL 3개 비교