
Purple Cloud는 UT Bot Alerts 와 마찬가지로 Buy, Sell 시그널을 포착합니다.
다양한 기술적 분석 요소를 통합하여 시장의 매수 및 매도 신호를 시각적으로 제공합니다.
B – buy
S – sell
🚀 – Strong buy
☄️ – Strong sell
트레이딩뷰: https://kr.tradingview.com/script/CcsssyQv/
Purple Cloud 구현
Strong 시그널은 구분하지 않고 전체 시그널을 포착하겠습니다.
pip install pandas ccxt numpyimport pandas as pd
import ccxt
import numpy as np
# 예시) 바이낸스 선물 BTCUSDT, 1시간 봉
bnb = ccxt.binance({'options': { 'defaultType': 'future' }})
# b1을 계산하는 함수
def calculate_b1(df, x1=14):
b1 = 0.0
b1_values = []
for i in range(len(df)):
if i == 0:
b1 = df['close'].iloc[:x1+1].mean()
else:
b1 = (b1 * (x1 - 1) + df['close'].iloc[i]) / x1
b1_values.append(b1)
df['b1'] = b1_values
return df
def Purple_Cloud(x1=14, alpha=0.7, bpt=1.4, spt=1.4):
ohlcv = bnb.fetch_ohlcv(symbol="BTC/USDT", timeframe="1h", limit=500)
df = pd.DataFrame(ohlcv, columns=['time', 'open', 'high', 'low', 'close', 'volume'])
# Y-m-d H:is로 변환
df['time'] = pd.to_datetime(df['time'], unit='ms').dt.tz_localize('UTC')
df['time'] = df['time'].dt.tz_convert('Asia/Seoul').dt.strftime('%Y-%m-%d %H:%M:%S')
df['b1'] = 0
df['hl2'] = (df['high'] + df['low']) / 2
df['HL'] = df['high'] - df['low']
df['HC'] = abs(df['high'] - df['close'].shift())
df['LC'] = abs(df['low'] - df['close'].shift())
df['TR'] = df[['HL', 'HC', 'LC']].max(axis=1)
df['ATR'] = df['TR'].ewm(alpha=1/x1, adjust=False).mean()
x2 = df['ATR'] * alpha
df['xh'] = df['close'] + x2
df['xl'] = df['close'] - x2
def vwma(source, volume, length):
return (source * volume).rolling(window=length).mean() / volume.rolling(window=length).mean()
# VWMA_1 and VWMA_2 calculations
df['HL2'] = (df['high'] + df['low']) / 2
df['VWMA_1'] = vwma(df['HL2']*df['volume'], df['volume'], int(np.ceil(x1 / 4))) / vwma(df['volume'], df['volume'], int(np.ceil(x1 / 4)))
df['VWMA_2'] = vwma(df['HL2']*df['volume'], df['volume'], int(np.ceil(x1 / 2))) / vwma(df['volume'], df['volume'], int(np.ceil(x1 / 2)))
df['VWMA_1'] = df['VWMA_1'].fillna(0)
df['VWMA_2'] = df['VWMA_2'].fillna(0)
a1 = df['VWMA_1']
a2 = df['VWMA_2']
a3 = 2 * a1 - a2
a4 = vwma(a3,df['volume'], x1)
df = calculate_b1(df)
a5 = 2 * a4 * df['b1'] / (a4 + df['b1'])
# Buy and Sell conditions
df['Buy'] = (a5 <= df['xl']) & (df['close'] > df['b1'] * (1 + bpt * 0.01))
df['Sell'] = (a5 >= df['xh']) & (df['close'] < df['b1'] * (1 - spt * 0.01))
# xs 상태 변수 초기화
xs = 0 # 초기값 설정
# Signal 계산
signals = []
for i in range(len(df)):
if df['Buy'][i]:
if xs != 1 :
signals.append('BUY')
else :
signals.append('')
xs = 1
elif df['Sell'][i]:
if xs != -1 :
signals.append('SELL')
else :
signals.append('')
xs = -1
else:
signals.append('')
df['signal'] = signals
# 시그널만 포착
signal = df[df['signal'] != '']
# 해당 컬럼만 보기
result = ["time", "open", "high", "low", "close", "volume", "signal"]
return signal[result]
print(Purple_Cloud(x1=14, alpha=0.7, bpt=1.4, spt=1.4)) # 트레이딩뷰 디폴트 값Check
트레이딩뷰 차트와 비교
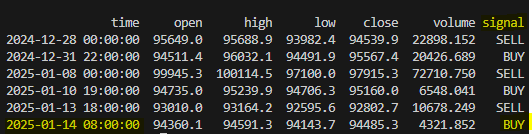
해당시간 BUY 시그널입니다.
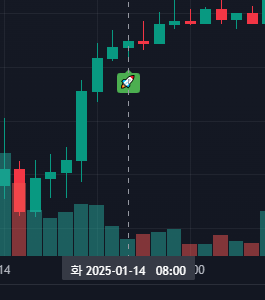
트레이딩뷰 지표와 동일합니다.