Rank Correlation Index(RCI)는 주가와 시간의 상관관계를 분석하여 시장의 추세 전환점을 파악하는 데 사용되는 기술적 지표입니다. 이 지표는 주어진 기간 동안 각 날짜와 해당 날짜의 주가 순위를 매겨, 이들 간의 상관계수를 계산합니다. RCI 값은 -100부터 100까지의 범위를 가지며, 100에 가까울수록 강한 상승 추세, -100에 가까울수록 강한 하락 추세를 나타냅니다.
Rank Correlation Index 구현
RCI, 이동평균(SMA) 을 구현하겠습니다.
import pandas as pd
import ccxt
import pinetopy as pp
import numpy as np
# Binance Futures, BTCUSDT, 1h
bnb = ccxt.binance({'options': { 'defaultType': 'future' }})
ohlcv = bnb.fetch_ohlcv(symbol="BTC/USDT", timeframe="1h", limit=500)
df = pd.DataFrame(ohlcv, columns=['time', 'open', 'high', 'low', 'close', 'volume'])
df['time'] = pp.kst(df['time'])
# TradingView Default Settings
def main(df, length=10, ma_length=14):
rci = np.full_like(df['close'], np.nan)
idx = np.arange(length)
close_values = df['close'].to_numpy()
for i in range(length - 1, len(close_values)):
rci[i] = (1 - 6 * np.sum((idx - np.argsort(np.argsort(close_values[i - length + 1:i + 1]))) ** 2) / (length * (length**2 - 1))) * 100
rci = pd.Series(rci)
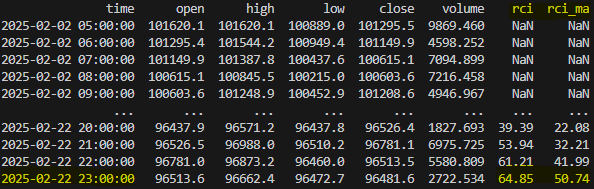
df['rci'] = rci.round(2)
df['rci_ma'] = pp.sma(rci, length=ma_length).round(2)
return df
print(main(df))Check
트레이딩뷰 차트와 비교