RVI (Relative Vigor Index)는 주식의 가격 움직임과 그 움직임의 강도를 비교하는 지표입니다. 이 지표는 종가가 시작가보다 높을 때 강세를 나타내고, 그 반대의 경우는 약세를 나타냅니다. RVI는 일반적으로 신호선과 함께 사용되며, 이 두 선의 교차는 매수 또는 매도 신호로 해석될 수 있습니다. 시장의 모멘텀을 평가하는 데 유용하며, 다른 기술적 지표와 함께 사용하면 더욱 효과적입니다.
Relative Vigor Index 구현
import pandas as pd
import ccxt
import pinetopy as pp
import numpy as np

# Binance Futures, BTCUSDT, 1h
bnb = ccxt.binance({'options': { 'defaultType': 'future' }})
ohlcv = bnb.fetch_ohlcv(symbol="BTC/USDT", timeframe="1h", limit=500)
df = pd.DataFrame(ohlcv, columns=['time', 'open', 'high', 'low', 'close', 'volume'])
df['time'] = pp.kst(df['time'])

def swma(series):
    return series.rolling(window=4).apply(lambda x: (x[0]*1 + x[1]*2 + x[2]*2 + x[3]*1) / 6, raw=True)

# TradingView Default Settings
def main(df, length=10):
    num = swma(df['close'] - df['open']).rolling(window=length).mean()
    den = swma(df['high'] - df['low']).rolling(window=length).mean()
    df['RVI'] = (num / den).round(4)
    df['SIG'] = swma(df['RVI']).round(4)

    return df[['time', 'RVI', 'SIG']]

print(main(df))
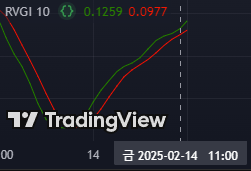
Check
트레이딩뷰 차트와 비교