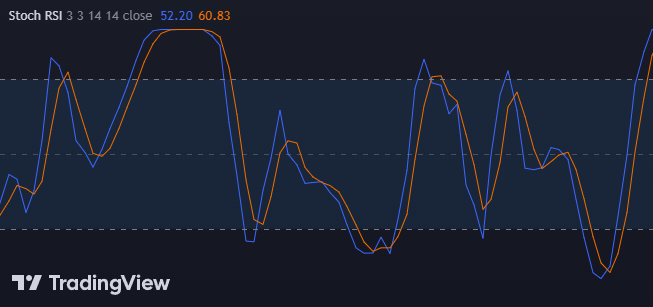
스토캐스틱 RSI 지표(스토캐스틱 RSI)는 본질적으로 지표의 지표입니다. 이는 기술적 분석에서 RSI 지표에 확률적 계산을 제공하기 위해 사용됩니다. 즉, 사용자가 정의한 기간 동안 자체 고점/저점 범위와 관련된 RSI의 측정값입니다. 스토캐스틱 RSI는 0과 1 사이의 값을 계산한 다음 선으로 표시하는 오실레이터입니다. 이 지표는 주로 과매수 및 과매도 상태를 식별하는 데 사용됩니다.
TradingView: https://kr.tradingview.com/support/solutions/43000502333/
Stochastic RSI 구현
pip install ta pandas ccxtimport ta
import pandas as pd
import ccxt
# 예시) 바이낸스 선물 BTCUSDT, 1시간 봉
bnb = ccxt.binance({'options': { 'defaultType': 'future' }})
def STOCH_RSI(length=14):
ohlcv = bnb.fetch_ohlcv(symbol="BTC/USDT", timeframe="1h", limit=500)
df = pd.DataFrame(ohlcv, columns=['time', 'open', 'high', 'low', 'close', 'volume'])
df['K'] = ta.momentum.StochRSIIndicator(close=df['close'], window=length).stochrsi_k()
df['D'] = ta.momentum.StochRSIIndicator(close=df['close'], window=length).stochrsi_d()
# 트레이딩뷰 차트와 동일하게 변경
df['K'] = (df['K'].fillna(0) * 100).round(2)
df['D'] = (df['D'].fillna(0) * 100).round(2)
return df
print(STOCH_RSI()) # 기본 14, 파라미터 변경하여 사용