TSI (True Strength Index)는 가격 변화의 강도를 측정하는 지표로, 단기 EMA(13일)와 장기 EMA(25일)를 적용하여 추세의 강도와 지속 가능성을 평가합니다. TSI 값이 0 이상이면 상승 추세를, 0 이하이면 하락 추세를 나타냅니다. 두 번의 EMA 적용을 통해 시장의 추세를 더 부드럽고 정확하게 분석할 수 있습니다.
True Strength Index 구현
pip install pandas ccxt pinetopy taimport pandas as pd
import ccxt
import pinetopy as pp
import ta.momentum
# 예시) 바이낸스 선물 BTCUSDT, 1시간 봉
bnb = ccxt.binance({'options': { 'defaultType': 'future' }})
ohlcv = bnb.fetch_ohlcv(symbol="BTC/USDT", timeframe="1h", limit=500)
df = pd.DataFrame(ohlcv, columns=['time', 'open', 'high', 'low', 'close', 'volume'])
df['time'] = pp.kst(df['time'])
def main(df, slow=25, fast=13):
data = ta.momentum.TSIIndicator(
close=df['close'],
window_slow=slow,
window_fast=fast
)
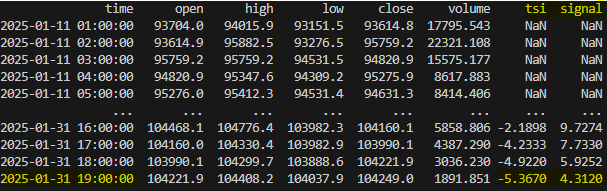
df['tsi'] = data.tsi().round(4)
df['signal'] = pp.ema(df=df['tsi'], length=fast).round(4)
return df
print(main(df, slow=25, fast=13)) # 트레이딩뷰 디폴트 값Check