윌리엄스 %R (Williams %R)은 Larry Williams가 개발한 모멘텀 지표로, 자산이 최근 N 기간 동안의 최고가와 최저가 범위 내에서 상대적으로 어디에 위치하는지를 나타냅니다.
과매수: -20 이상 (-20 ~ -0) → 가격 하락 가능성 (매도 기회 고려)
과매도: -80 이하 (-80 ~ -100) → 가격 상승 가능성 (매수 기회 고려)
Wikipedia: https://en.wikipedia.org/wiki/Williams_%25R
Williams %R 구현
pip install pandas ccxtimport pandas as pd
import ccxt
# 예시) 바이낸스 선물 BTCUSDT, 1시간 봉
bnb = ccxt.binance({'options': { 'defaultType': 'future' }})
def Williams_R(length=14):
ohlcv = bnb.fetch_ohlcv(symbol="BTC/USDT", timeframe="1h", limit=500)
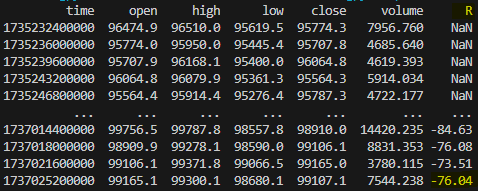
df = pd.DataFrame(ohlcv, columns=['time', 'open', 'high', 'low', 'close', 'volume'])
highest_high = df['high'].rolling(window=length).max()
lowest_low = df['low'].rolling(window=length).min()
df['R'] = 100 * (df['close'] - highest_high) / (highest_high - lowest_low)
df['R'] = df['R'].round(2)
return df
print(Williams_R(length=14)) # 트레이딩뷰 디폴트 값Check
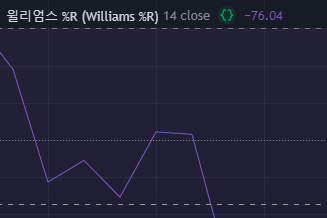
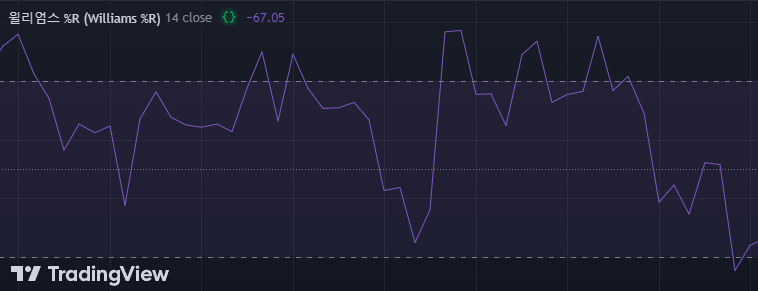
트레이딩뷰 차트와 비교